So if you read my post about Node Red and OLA, then you might have been asking yourself.. what is the point.
Heres a point!
I am building/have built/will build LED drivers and I need to asses and work on the dimming curve on them. I can do this with my eyes, but when you are dealing with 16bit values and trying to get a most excellent linear response as a starting point, it is allot of leg work. (And typing..)
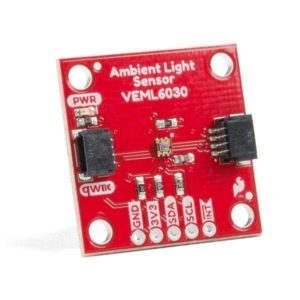
This week I got one of these VEML6030 breakout boards from coolcomponents.co.uk I have hooked it up to the setup and mentioned in that other post via an ESP8266 board from Heltec – Wifi Kit 8 .

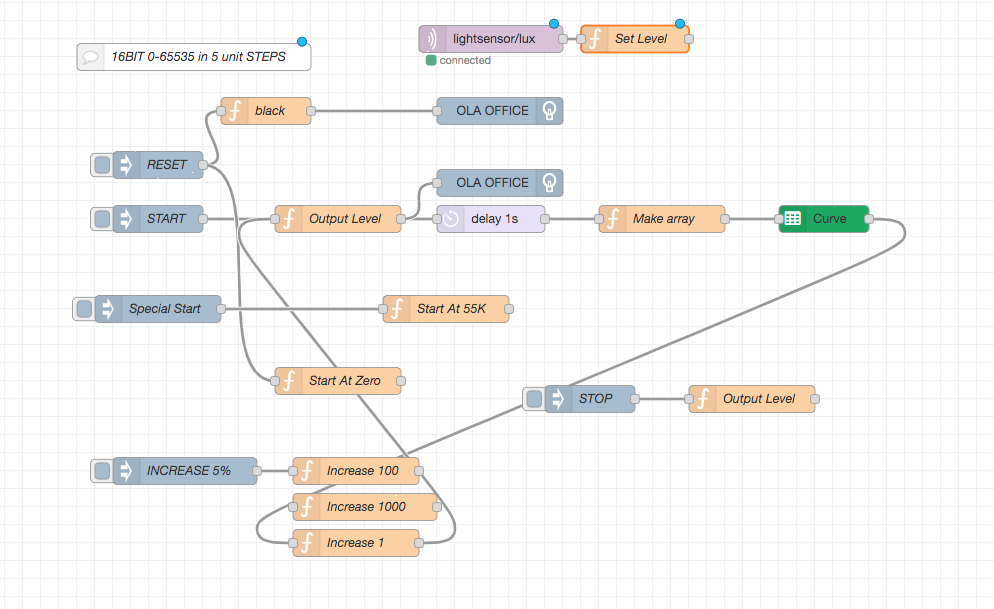
So now I have Node Red driving DMX, which is turning on a bit of LED tape via my driver, and then getting back a lux value from this sensor that I have jammed on top of the tape with a bit of make it dark cardboard… The resolution of this sensor when stuck on in this way is pretty amazing, it returns a 16bit value, and I can see a light level change between 655200 and 655201….
Enter the gsheet node, which allows you to send out data to a gsheet. Its the one in the green on the right. It deals with all the auth you have to do to write into a spread sheet remotely without having to resort to a Google Form, which is a serious tedious process.

With this arrangement I can hit go, and the thing will increment up the steps of output while taking a reading each time and banging them into my sheet. Push that into a graph and I can see just how awful my curve is…. and then start mangling the numbers to make it better. When I want to test again I just hit go and it runs the measurements while I think about how bad the curve was last time.
The google API has a limit of 100 calls in 100 seconds. So that means I can only go with a delay between increases in DMX level of 1 second. Increasing by 100 points each time took 11 mins. But that wasn’t quite enough resolution, so I am currently re running a bit of it increasing by 1 point every one second… which is more than enough time for me to write this……
